When designing the graphical interface of the WATCHDOG system,
we considered that visual monitoring is a very important aspect of IT operations monitoring systems.
It must be user-friendly and professional enough to be easily understood by both novices and experts,
while also meeting the advanced debugging and tracking needs of professional engineers.
Integrating the overall information of IT equipment is a basic requirement.
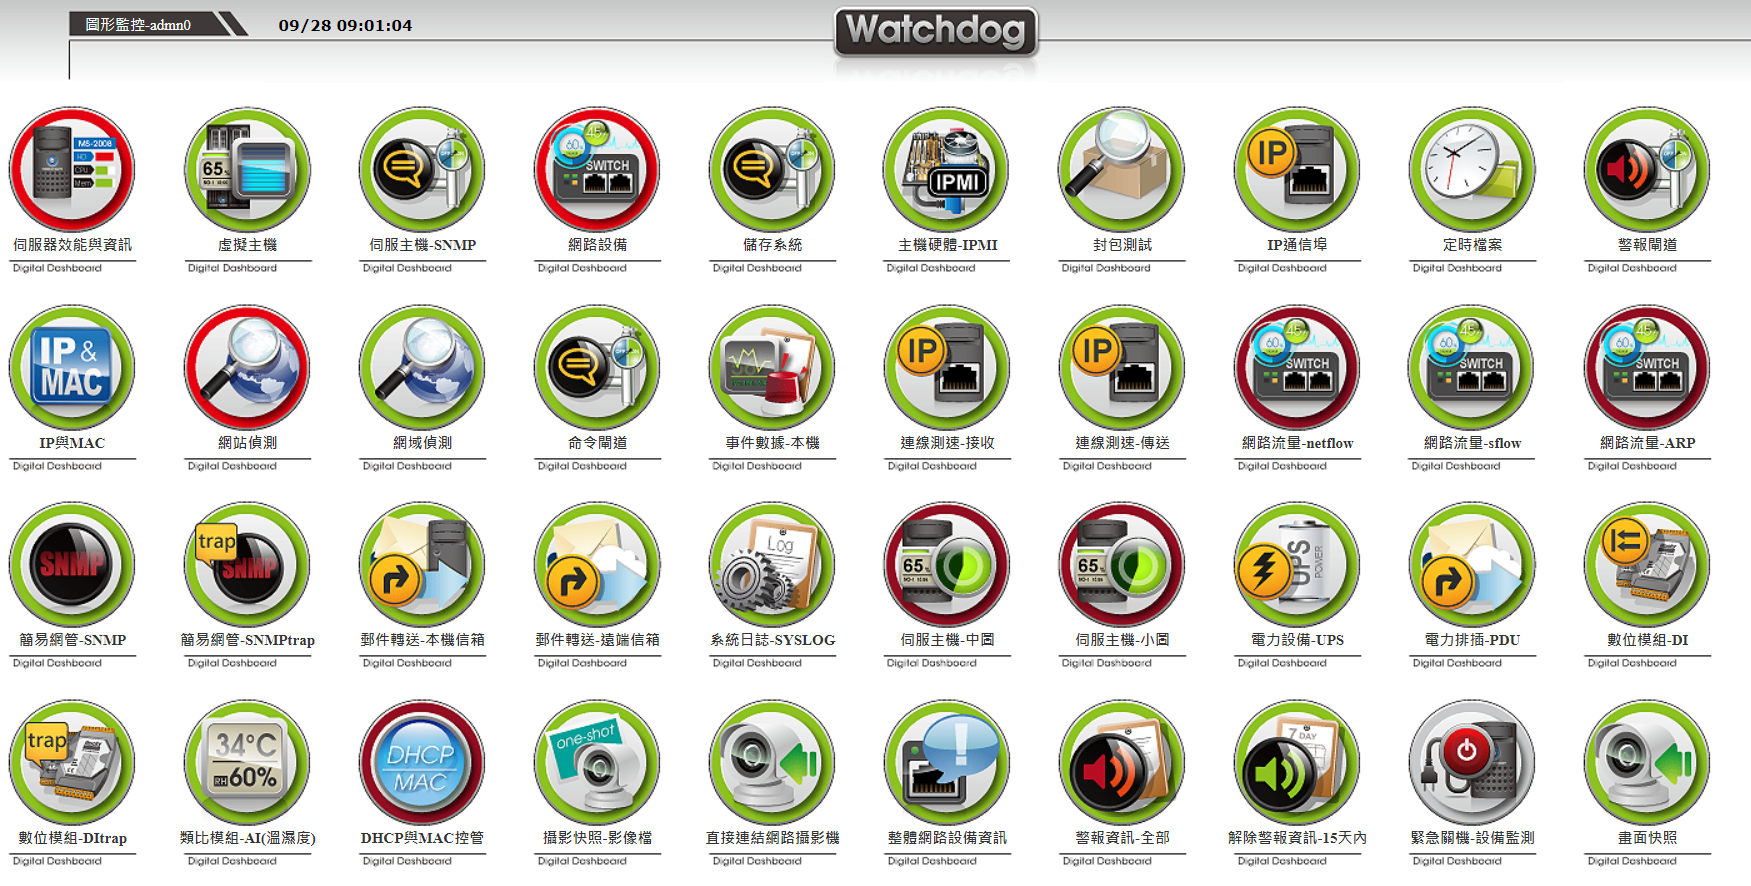
WATCHDOG System - Graphical Monitoring Classification:
➢ Real-time information war room monitoring charts
➢ Real-time status charts for each monitoring category
➢ Traffic analysis charts
➢ Performance analysis charts
➢ Data analysis charts
➢ Circular ratio analysis charts
➢ Ranking statistical analysis charts
➢ Alarm analysis charts
➢ Long-term data lists
➢ Ranking analysis charts
➢ Text-type list details charts
The following introduces the diverse graphical interfaces in the Watchdog system, covering key interfaces from the central control center and alarm center to various detection screens.
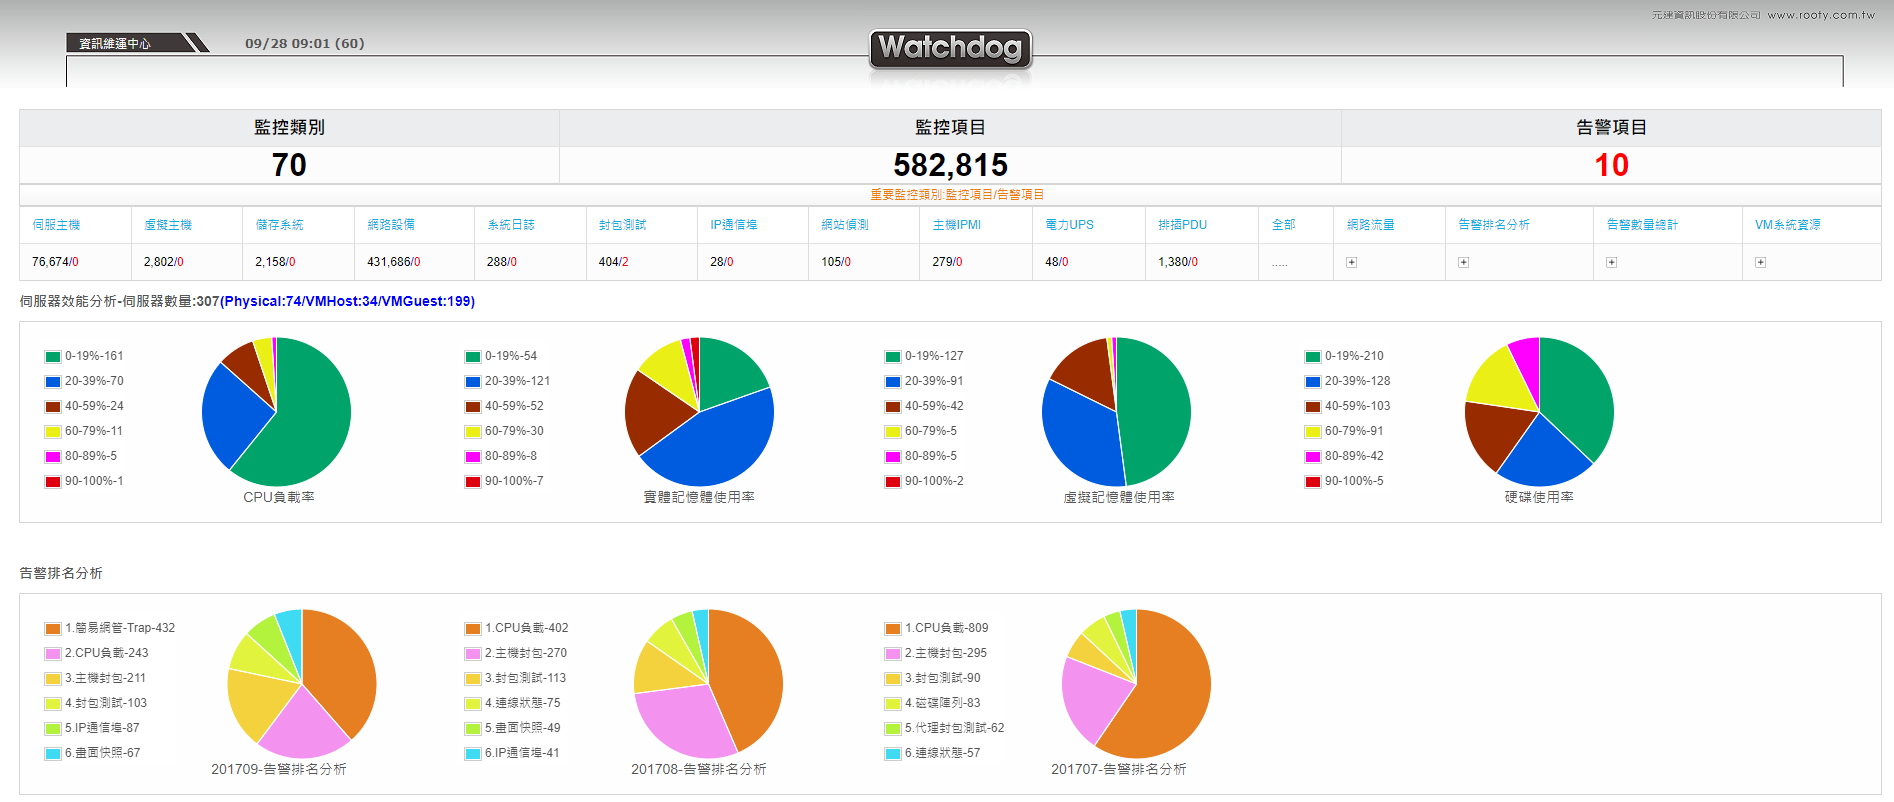
WATCHDOG System - IT Operations Center Homepage
The operations center homepage is designed as a one-stop overview platform, aiming to provide a comprehensive system status summary,
including the total number of detection items, the current number of alarm events, and multi-dimensional statistical analysis charts.
Additionally, the platform integrates quick links to various detection devices,
allowing users to conveniently perform in-depth inspections or management, ensuring real-time system monitoring and data analysis capabilities.
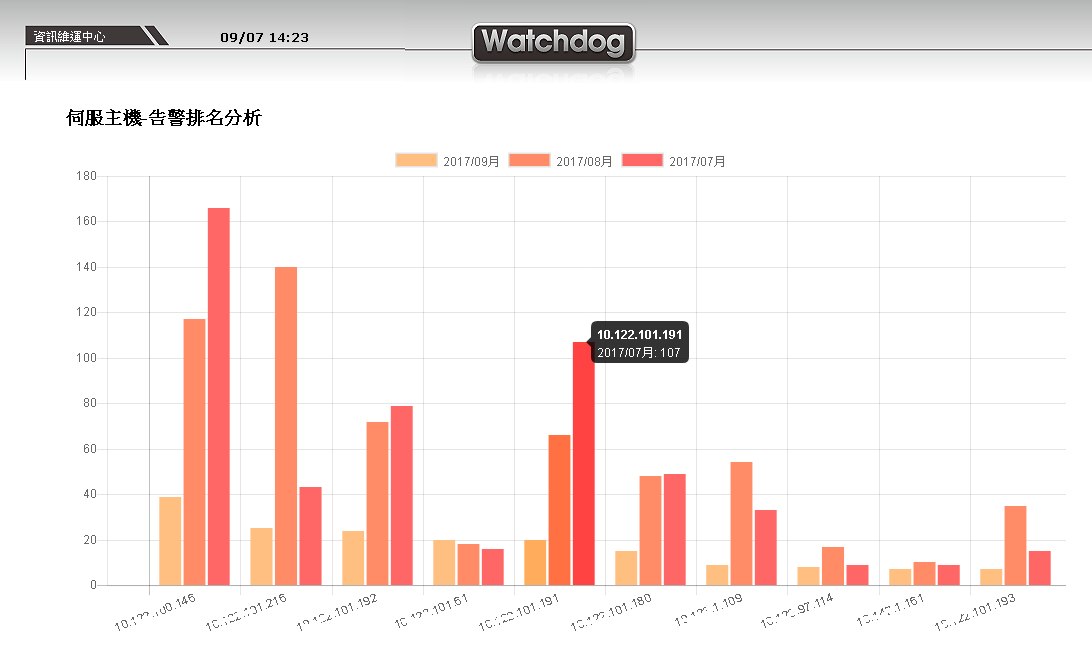
Server - Top 10 Alarms in the Last Three Months
Specifically for servers under each IP address, ranking and comparative analysis of the number of alarms triggered in the past three months.
Additionally, the system provides annual alarm data analysis charts to support long-term trend monitoring and evaluation, thereby optimizing server operation and maintenance strategies.
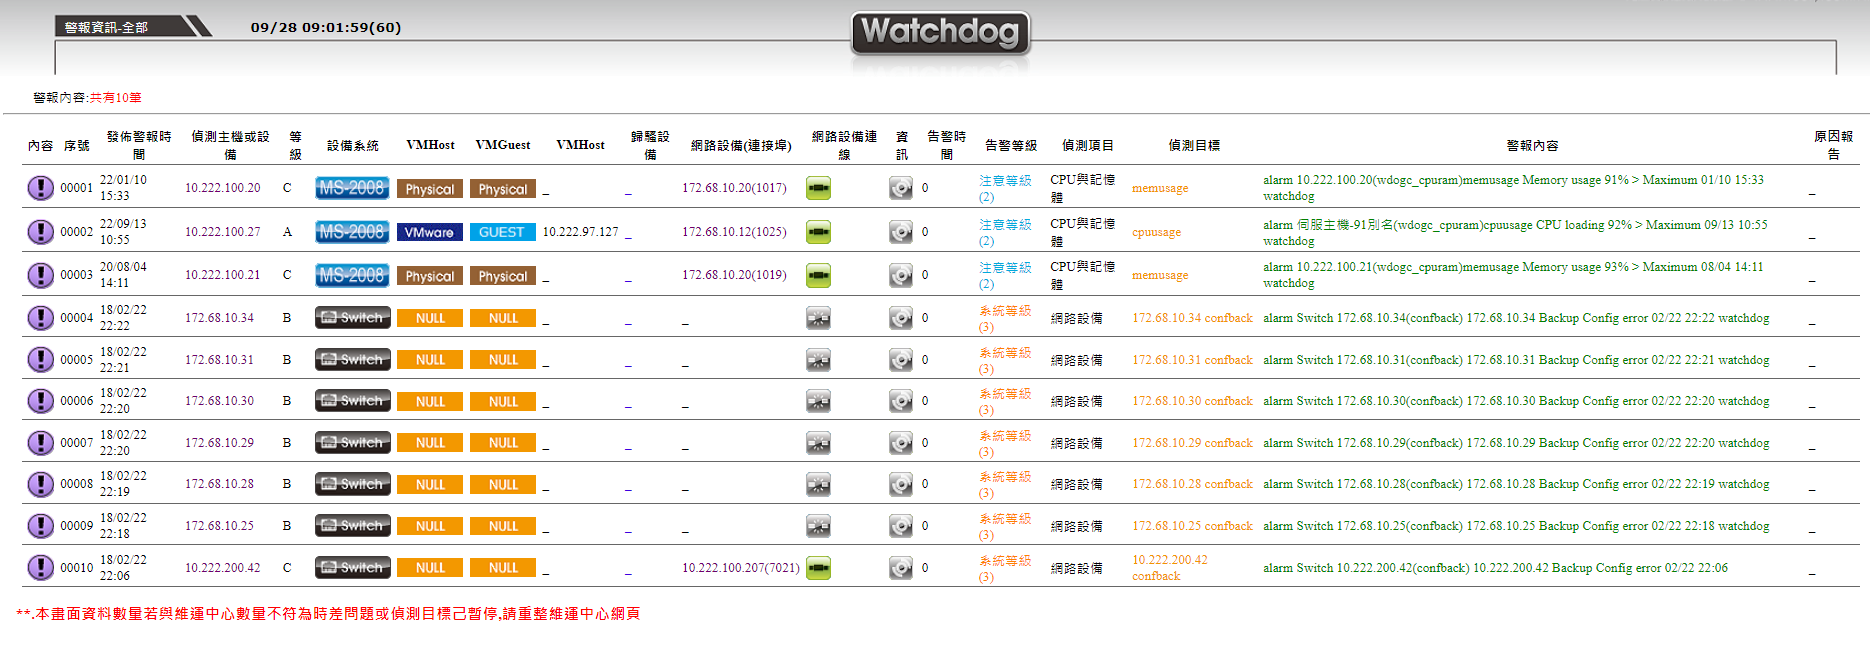
Alarm Center
Designed for real-time alarm monitoring and management, providing users with a centralized view to monitor and track triggered alarm events.
This interface supports direct links to the detection locations of related devices and allows viewing of memo data and detailed information of alarm events,
including the occurrence time, trigger reasons, and other key data, facilitating efficient fault diagnosis and decision-making.
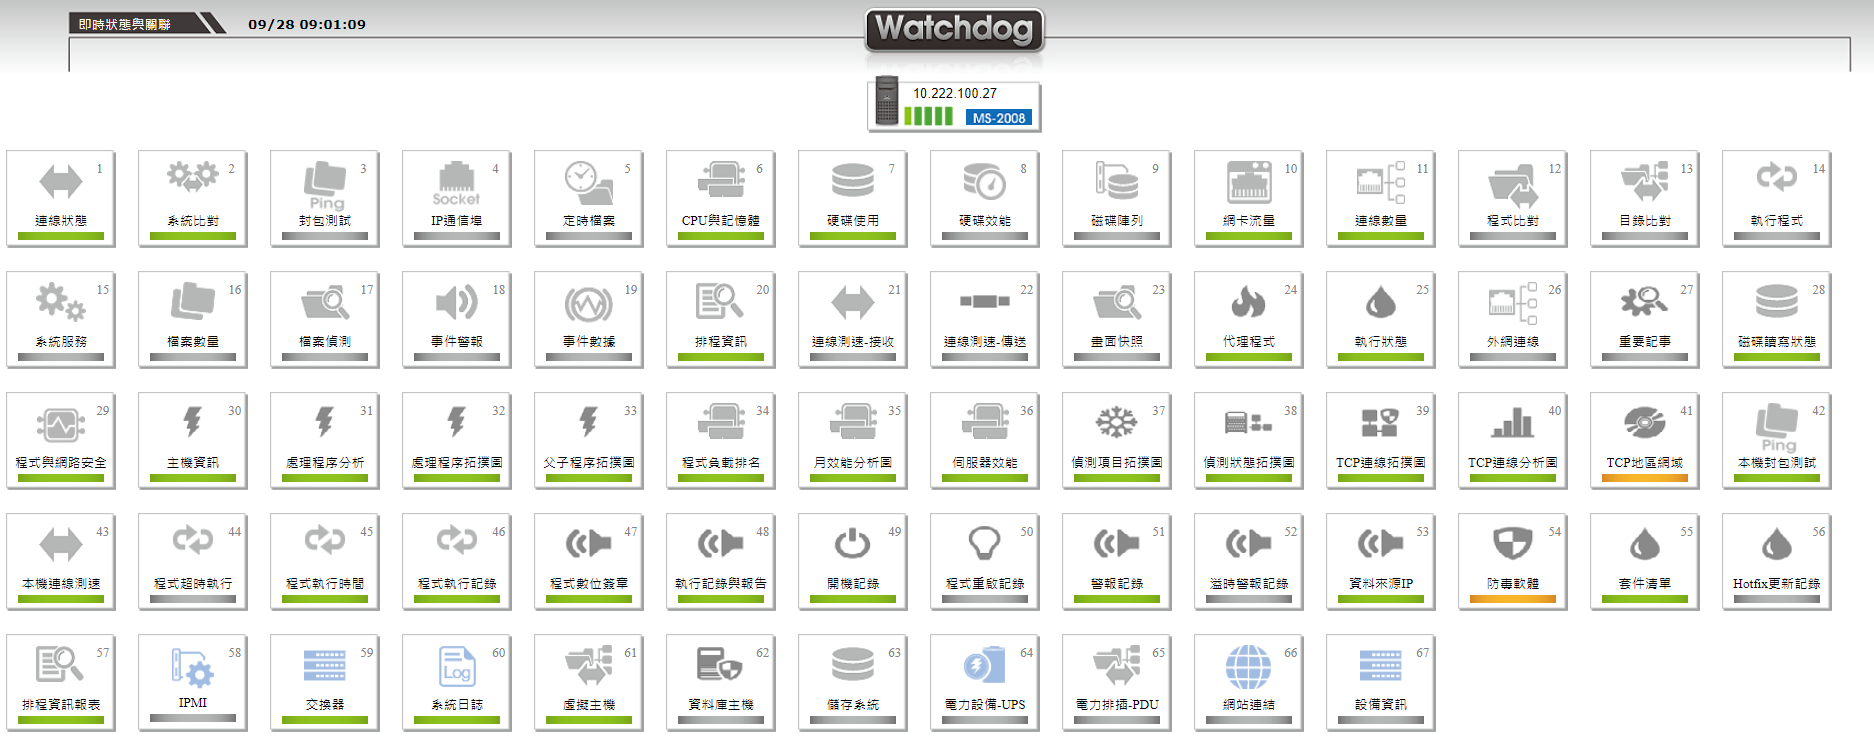
Monitoring Categories (Main)
Each chart represents an independent monitoring indicator, using color coding to show the system's health status.
When all sub-items under the monitoring item are operating normally, the system interface will display a green indicator light, symbolizing stability;
on the contrary, if any sub-item triggers an alarm, the monitoring item will immediately turn red, alerting administrators to potential issues.
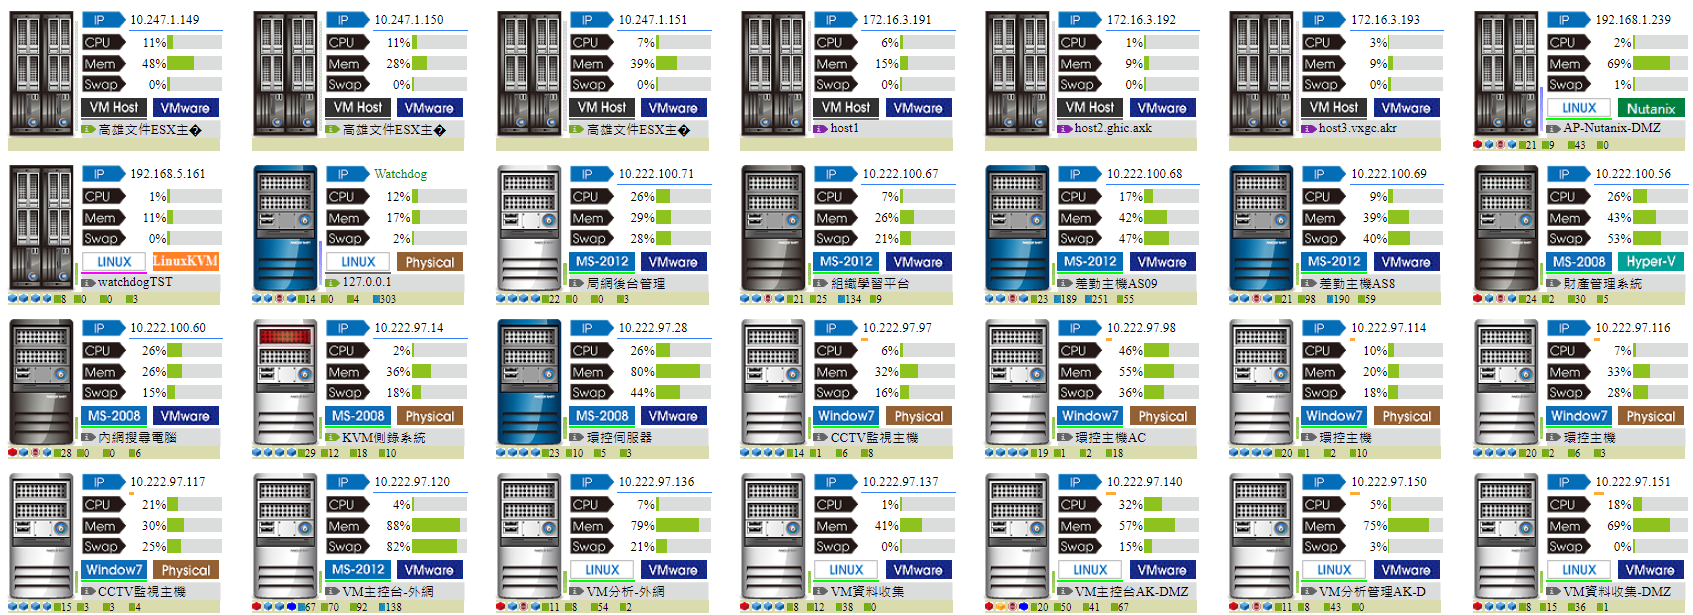
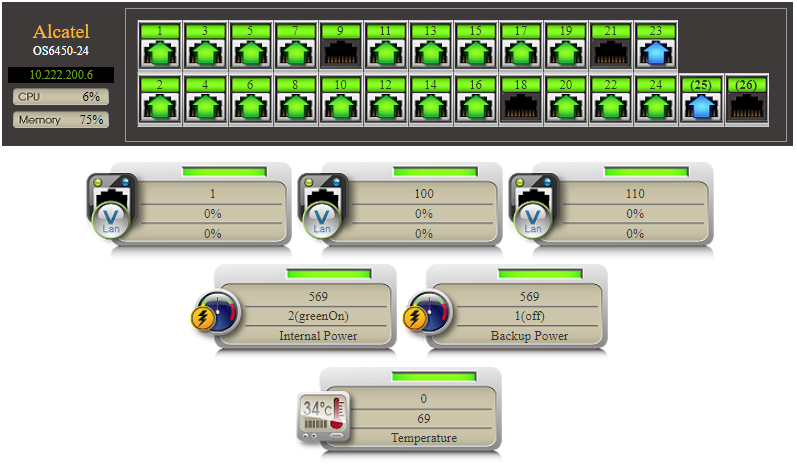
Server - Overall
On the homepage of the server monitoring interface, based on different monitoring needs, the displayed information can be divided into three sizes: small, medium, and large. Particularly in the large mode,
each server can display about 30 different status information.
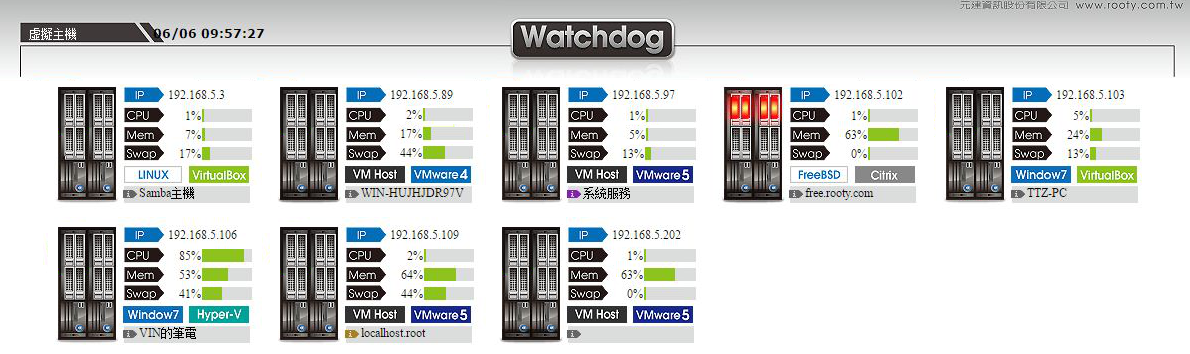
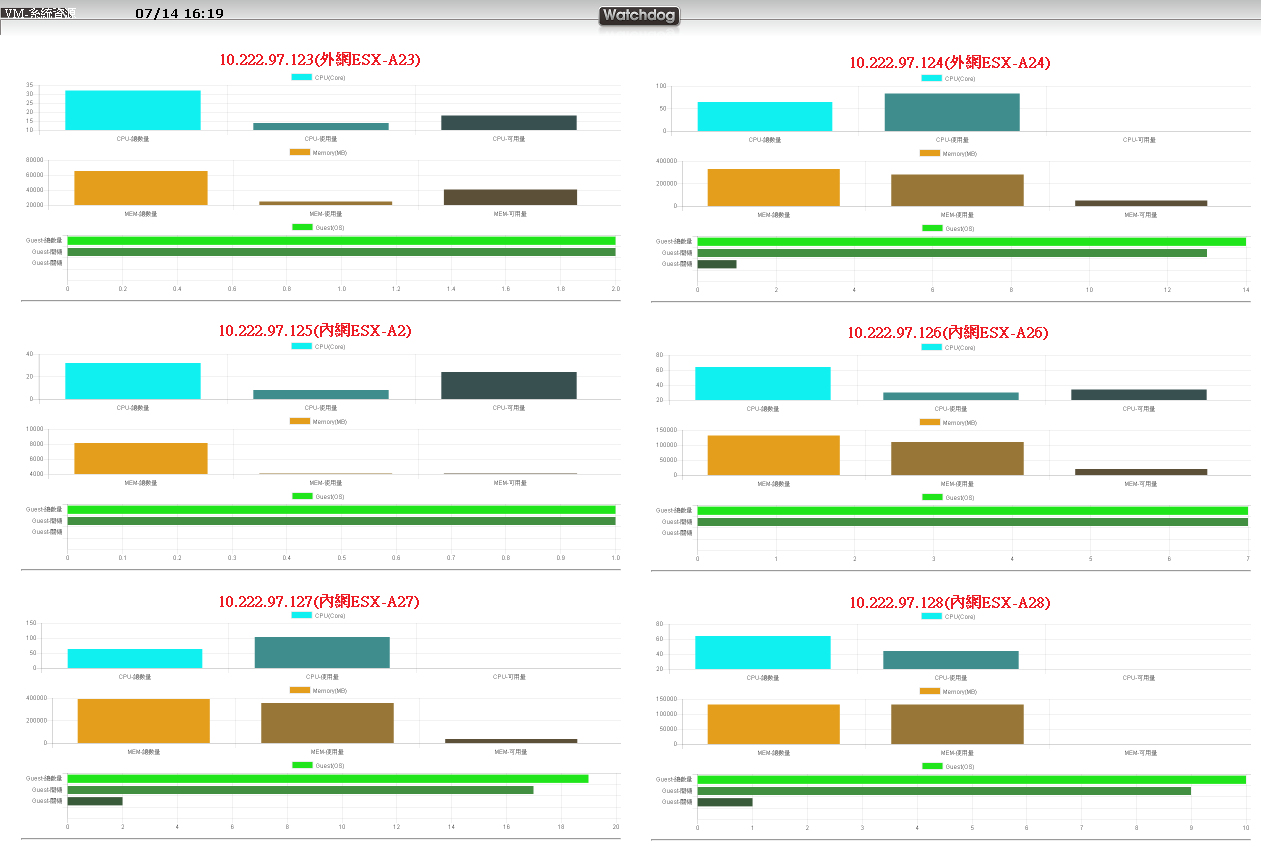
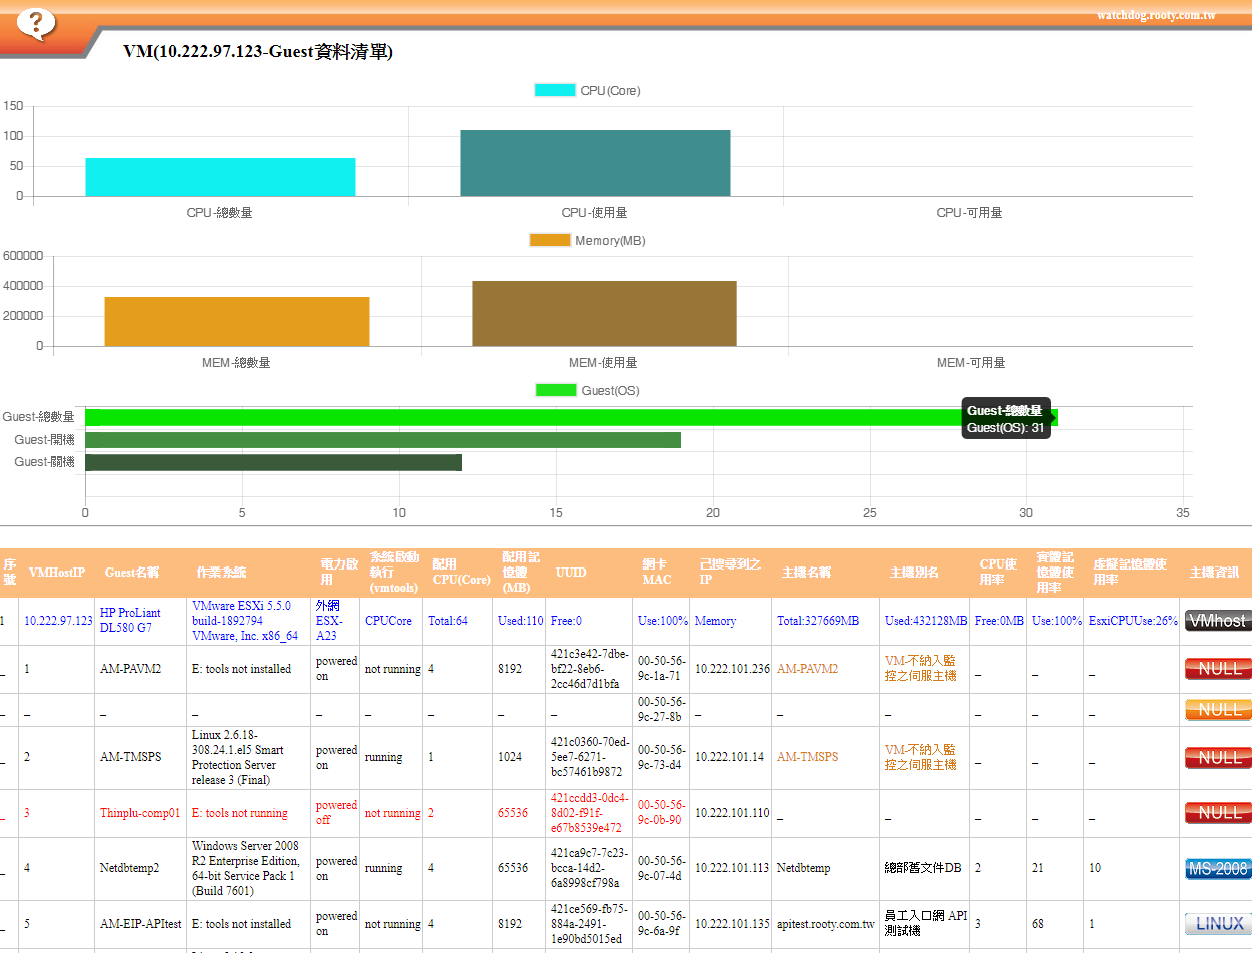
VMHost - Virtual Machine
For VMHost (ESXi) virtual machine environments, the monitoring interface can be displayed independently, dedicated to in-depth monitoring and analysis.
This detection page covers key monitoring information including the virtual guest (Guest host) list and their resource allocation status.
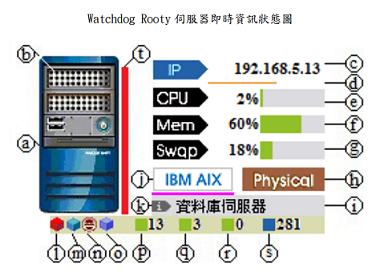
Server - Detection Items
The server monitoring architecture is divided into three levels to provide comprehensive detection and monitoring scope.
➢ Hardware layer: Hardware indicators and management interfaces, such as IPMI and ILO technology, as well as disk array status, temperature, power, and fans.
➢ Operating system layer: Monitoring of core system resources, including CPU usage, memory allocation, etc.
➢ Application system layer: Focused on the running status of applications, event alarms, and data collection, supporting high-level application performance monitoring and analysis.
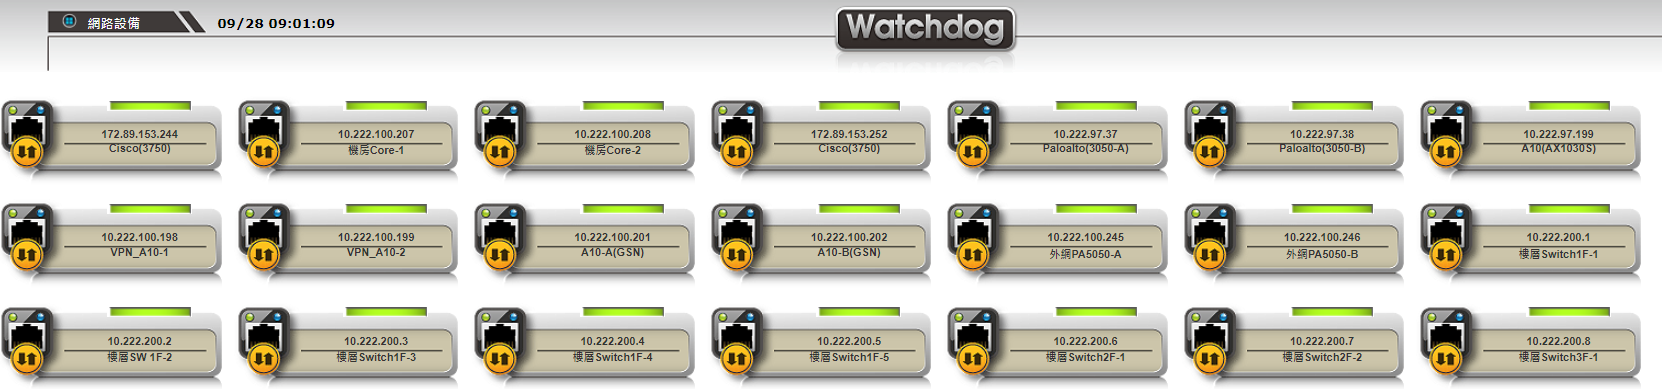
Network Devices
Including switches, firewalls, and load balancers.
Through the graphical interface, administrators can monitor connection status and obtain rich information in real-time.
This solution emphasizes switch monitoring,
providing visual tools such as Switch topology maps, traffic load ratios, and Core Switch topology maps to facilitate comprehensive network status evaluation and management.
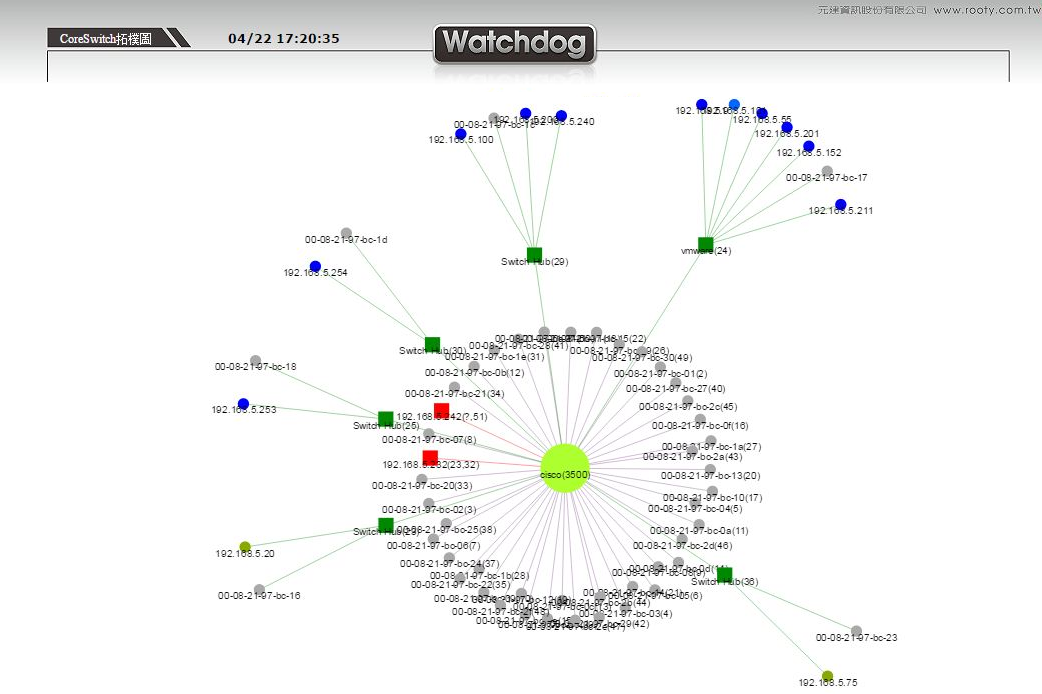
For comprehensive switch monitoring, the system supports displaying key indicators such as VLAN distribution maps, switch port speed distribution maps, and Port status maps.
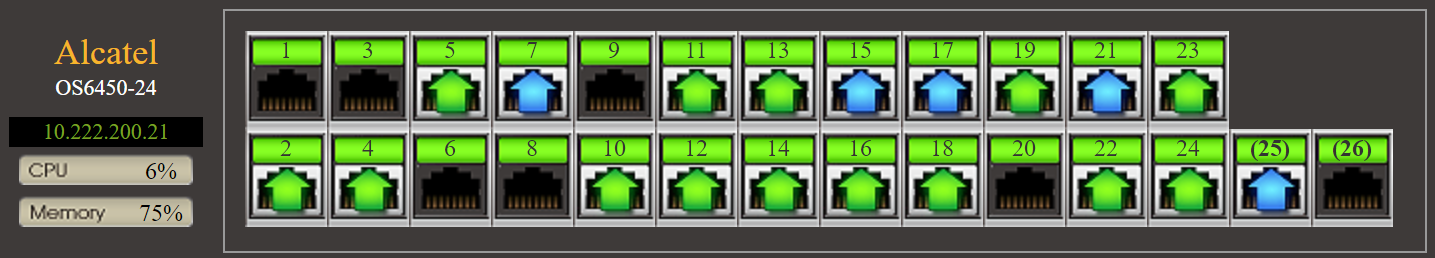
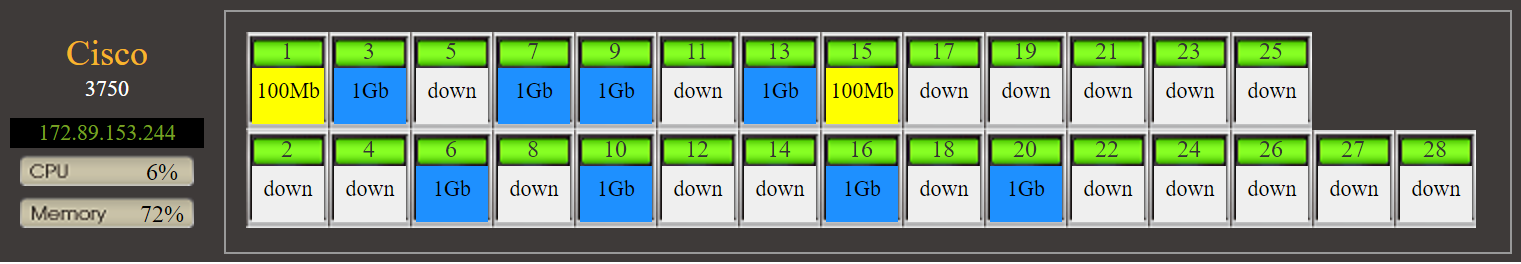
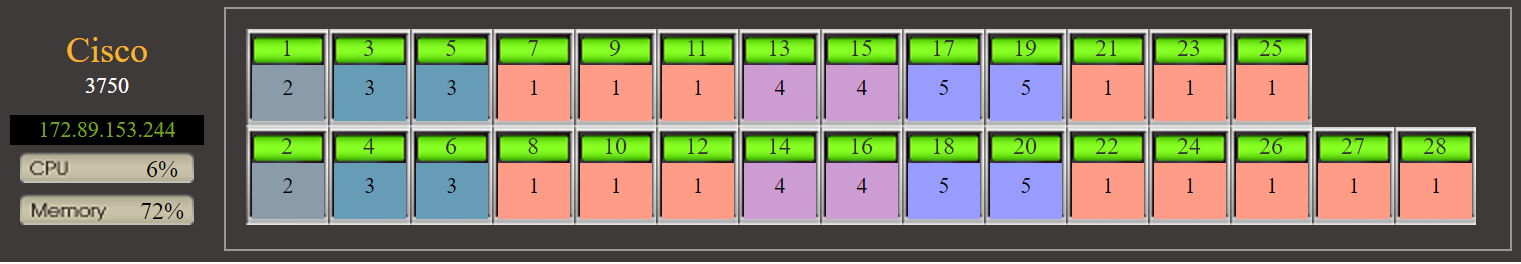
If the SNMP of the Switch includes information such as voltage, fans, temperature, etc., it will also be displayed.
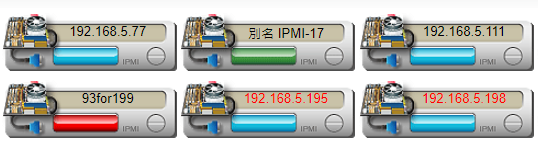
Host Hardware - IPMI
Covering key monitoring indicators such as temperature sensors, fan speeds, voltage and current monitoring, and power supply status.
Including HP's iLO (Integrated Lights-Out), IBM's IMM (Integrated Management Module), and Dell's iDRAC (Integrated Dell Remote Access Controller).
By incorporating IPMI into monitoring, administrators can not only detect and address issues caused by hardware faults in real-time,
but also use IPMI to issue power on/off commands to servers through the WATCHDOG system, and further utilize the 【Command Gateway】 function with IPMI,
to implement 【One-Click Shutdown】 for hundreds of servers.
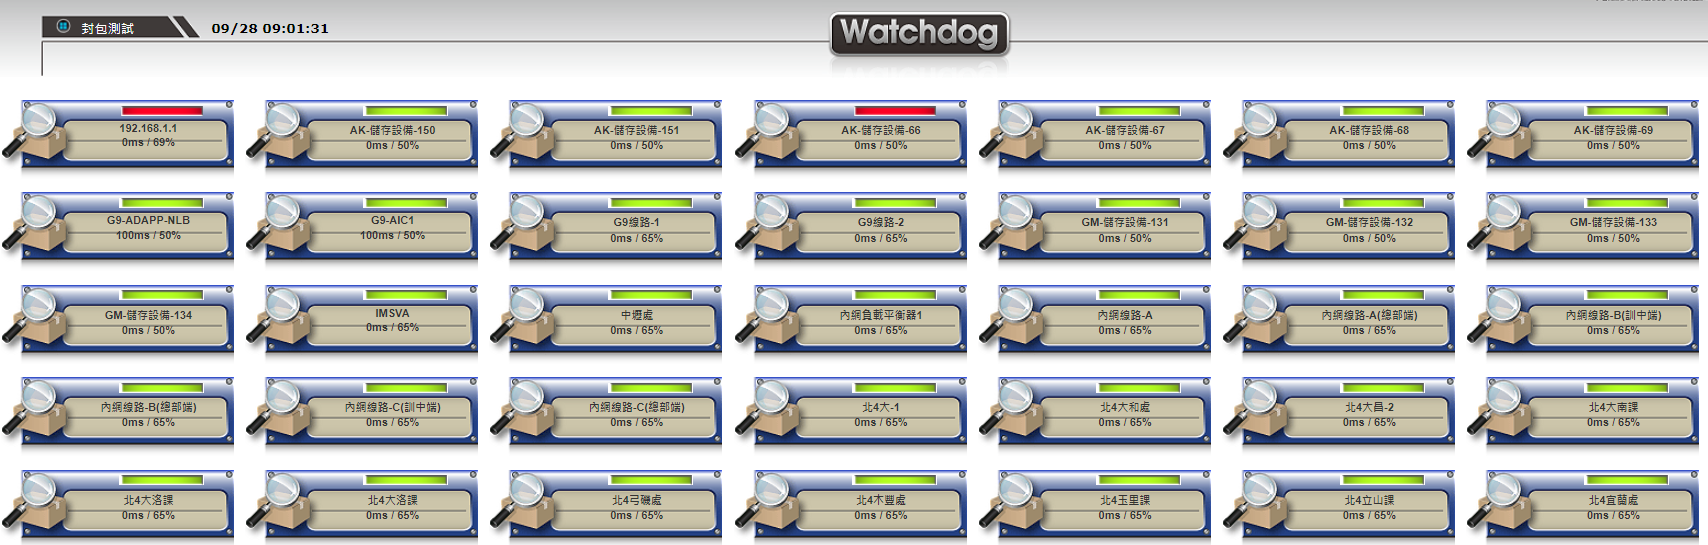
Packet Testing
Packet testing is mainly used to measure the reliability and efficiency of network connections.
This method focuses on two core indicators:
➢ Packet loss percentage (loss)
➢ Packet response time (time)
Automating the routine ping operation performed by system administrators
(i.e., sending packets to test the response of network devices), transforming it into periodic automatic detection.
Furthermore, through network path tracing technology, packet testing can accurately locate fault points in network connections, thereby facilitating quick and effective problem resolution, ensuring stable network operation.
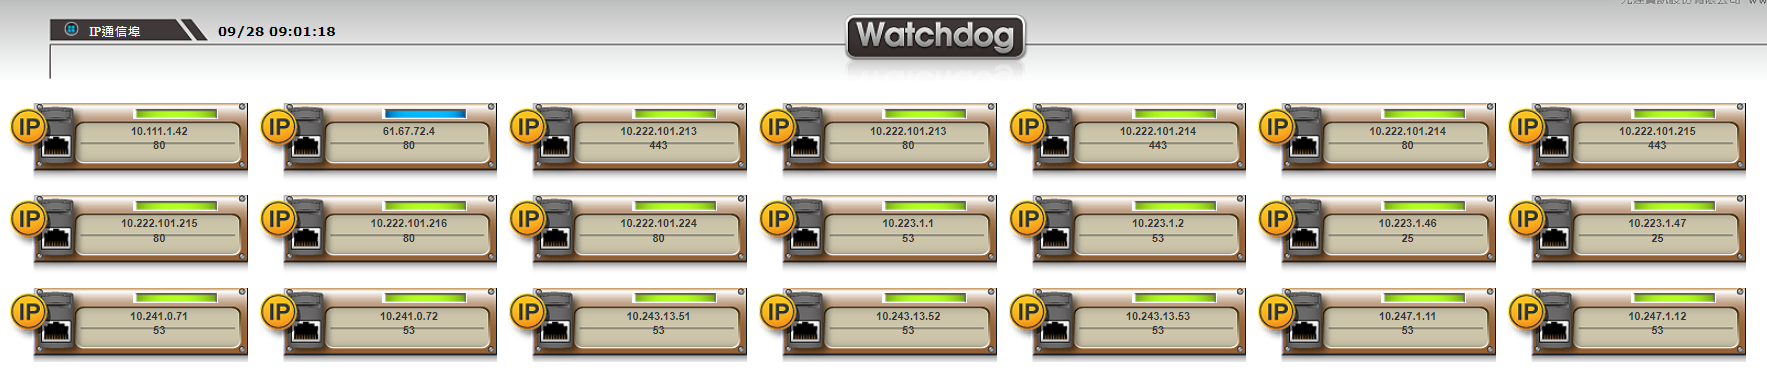
IP Ports
For devices with network service capabilities, performing regular socket connection monitoring
to confirm whether the network service program or connection of the host is interrupted,
and to detect whether the service waiting for connection is in an illegal listening state.
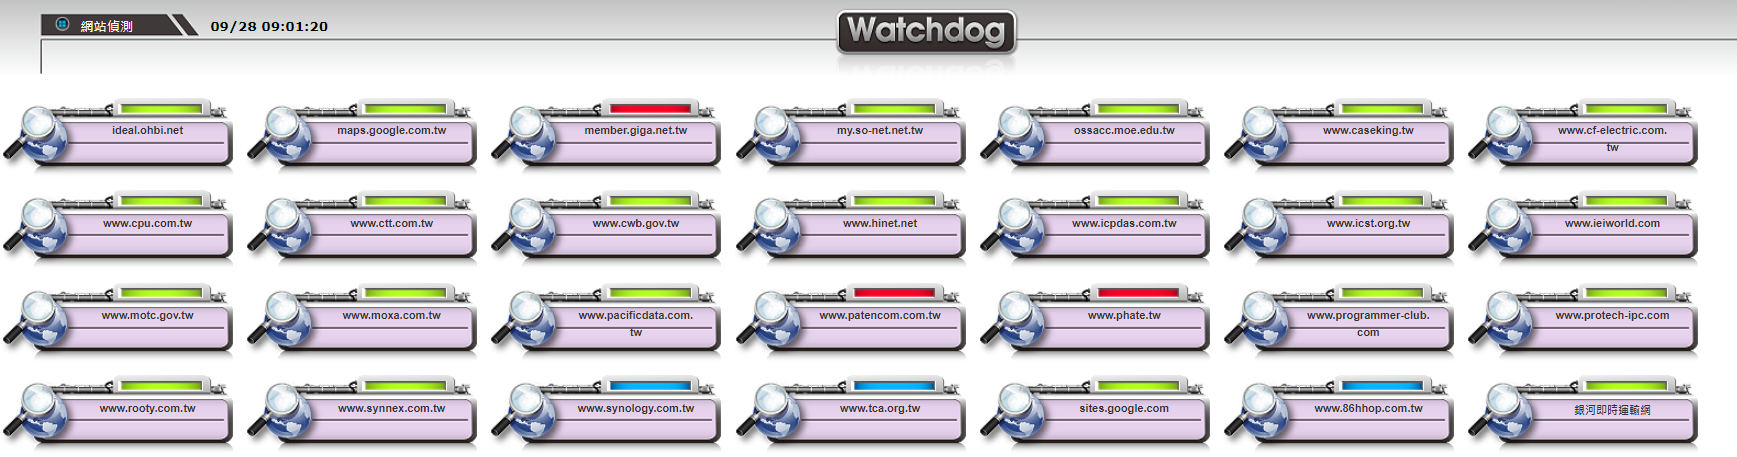
Website Detection
Website detection uses regular sampling, with each website sampling up to 10 web pages to collect data,
ensuring that each node of the network connection is smooth to ensure the normal operation of the website,
while detecting network connection and DNS resolution, WEB Server service status such as: Apache and IIS, middleware such as Java AP,
background database connection or system status, obtaining the time it takes to load the webpage and comparing the content of the webpage to ensure it has not been tampered with.
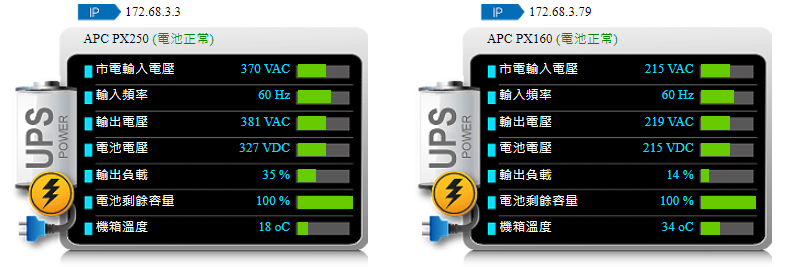
UPS - Uninterruptible Power Supply
【Power Equipment - UPS】 is one of the auxiliary monitoring functions for computer room environment monitoring,
playing an indispensable role in maintaining the uninterruptible power supply system (UPS) of the information center.
The Watchdog IT operations monitoring system not only focuses on the daily monitoring of IT equipment,
but also emphasizes power equipment in environmental monitoring items to ensure overall operational continuity and performance optimization.
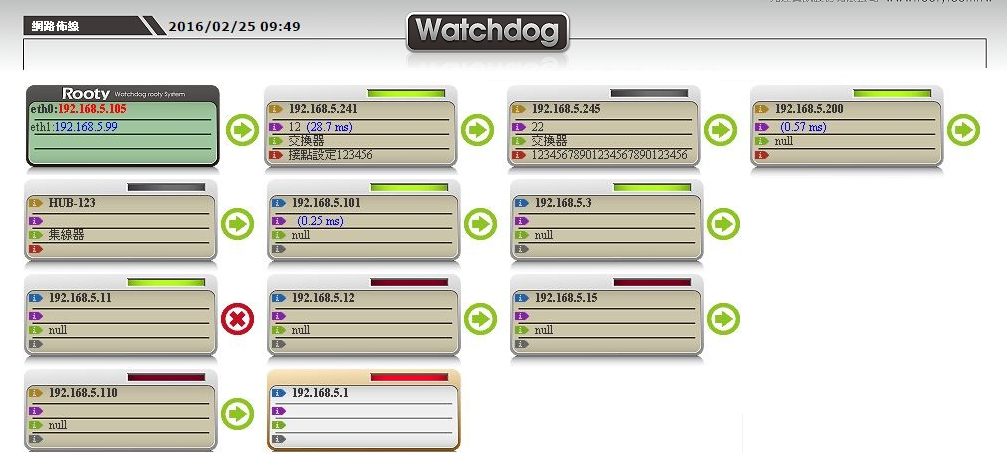
Network Wiring
The network wiring diagram shows all the nodes between two network devices, using the ping command to test each unresolved node in the network wiring diagram,
and then identify problematic network devices.
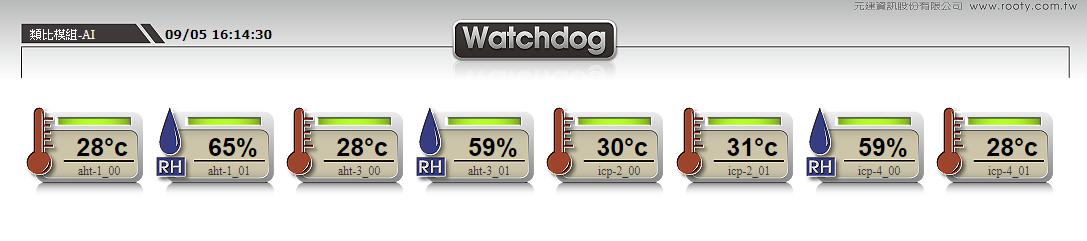
Temperature/Humidity Sensors
In the Watchdog IT operations monitoring system, the auxiliary monitoring function of temperature and humidity sensors is not a primary monitoring item,
but Watchdog still provides corresponding auxiliary monitoring.
Other items include the following, click on each detection function item for more detailed information.